User Experience & Interface Design
-
Analytics Cloud was designed to have dashboards at its focal point; an interface in which various analytics are presented and visualized in a way that's easy to understand and draw out insights from. Every dashboard is populated with certain types of data cards depending on the type of dashboard being viewed. Users can view dashboards of individual customer profiles, dashboards of customer segments based on custom filtered criteria, and dashboards detailing how marketing assets are performing throughout all the various touch points the user's business has with its customers and prospects. Through the utilization of these features, users can get a complete view of their customers and gauge the effectiveness of their marketing campaigns.
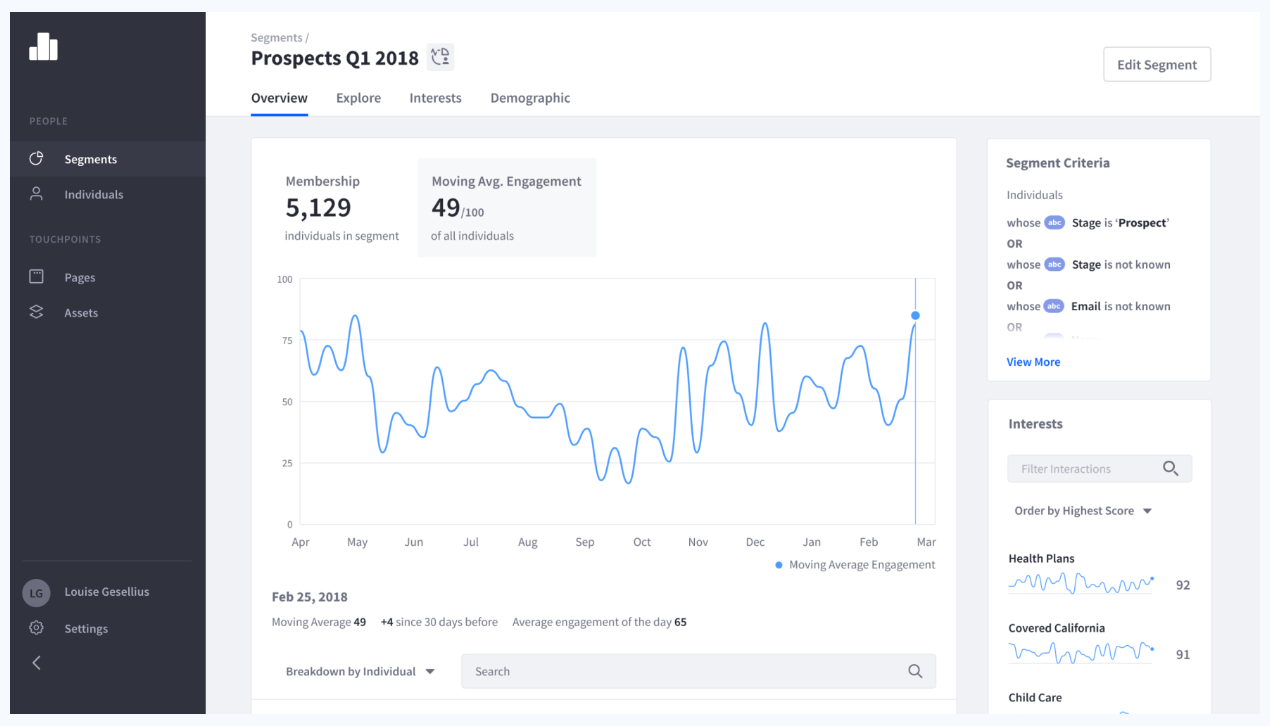
Example of a profile dashboard for a segment of customers.
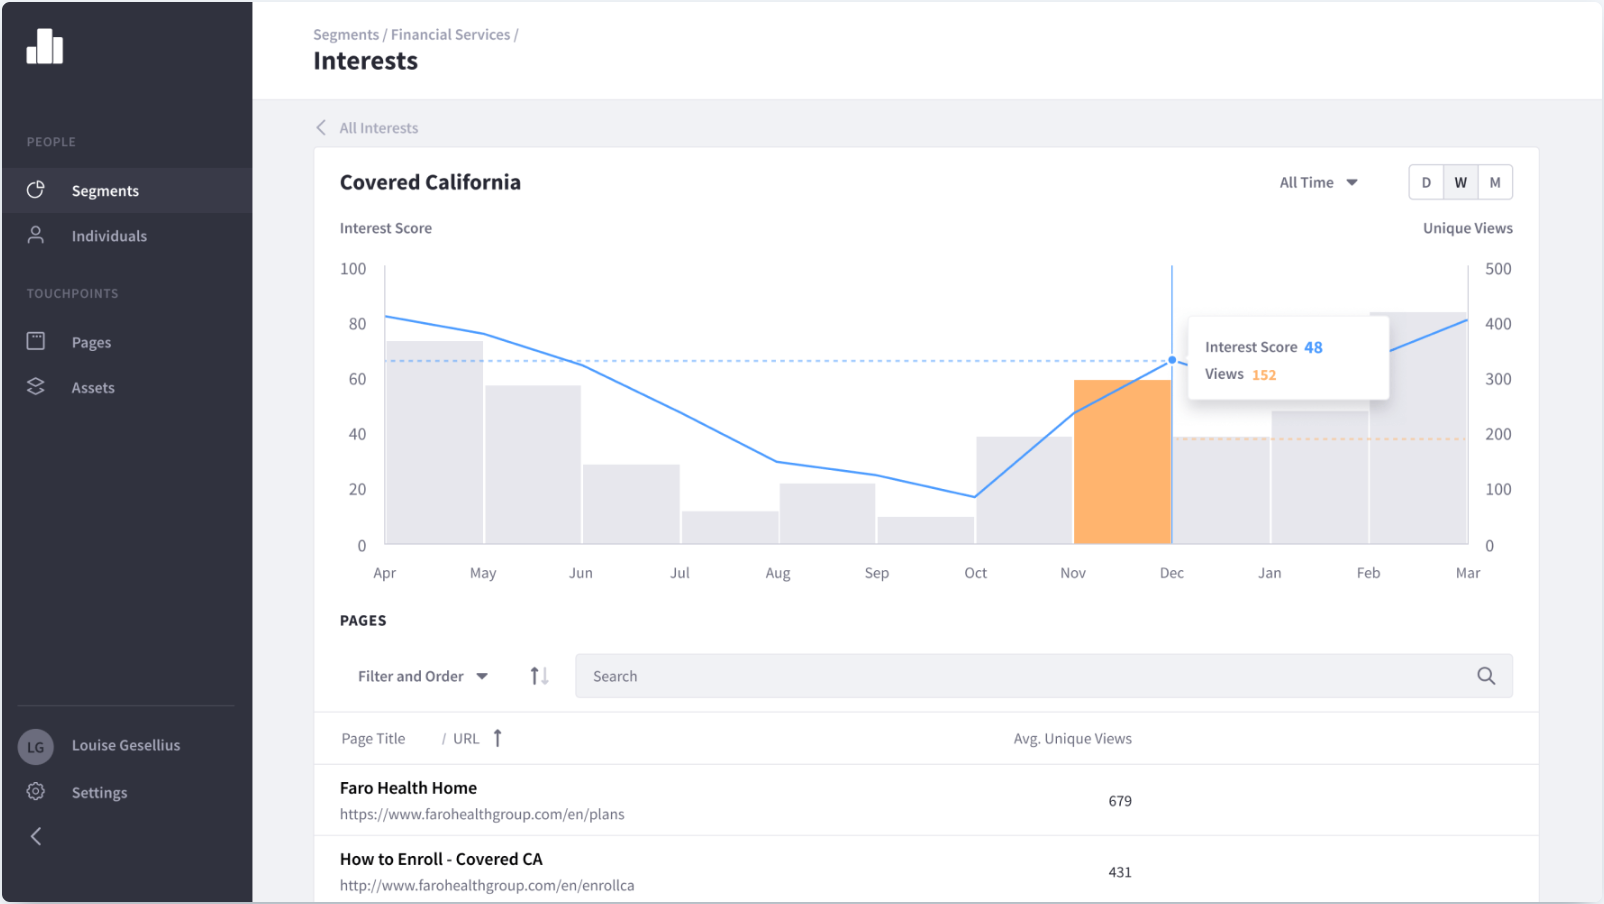
Example of a screen which displays more information for a data card on a dashboard.
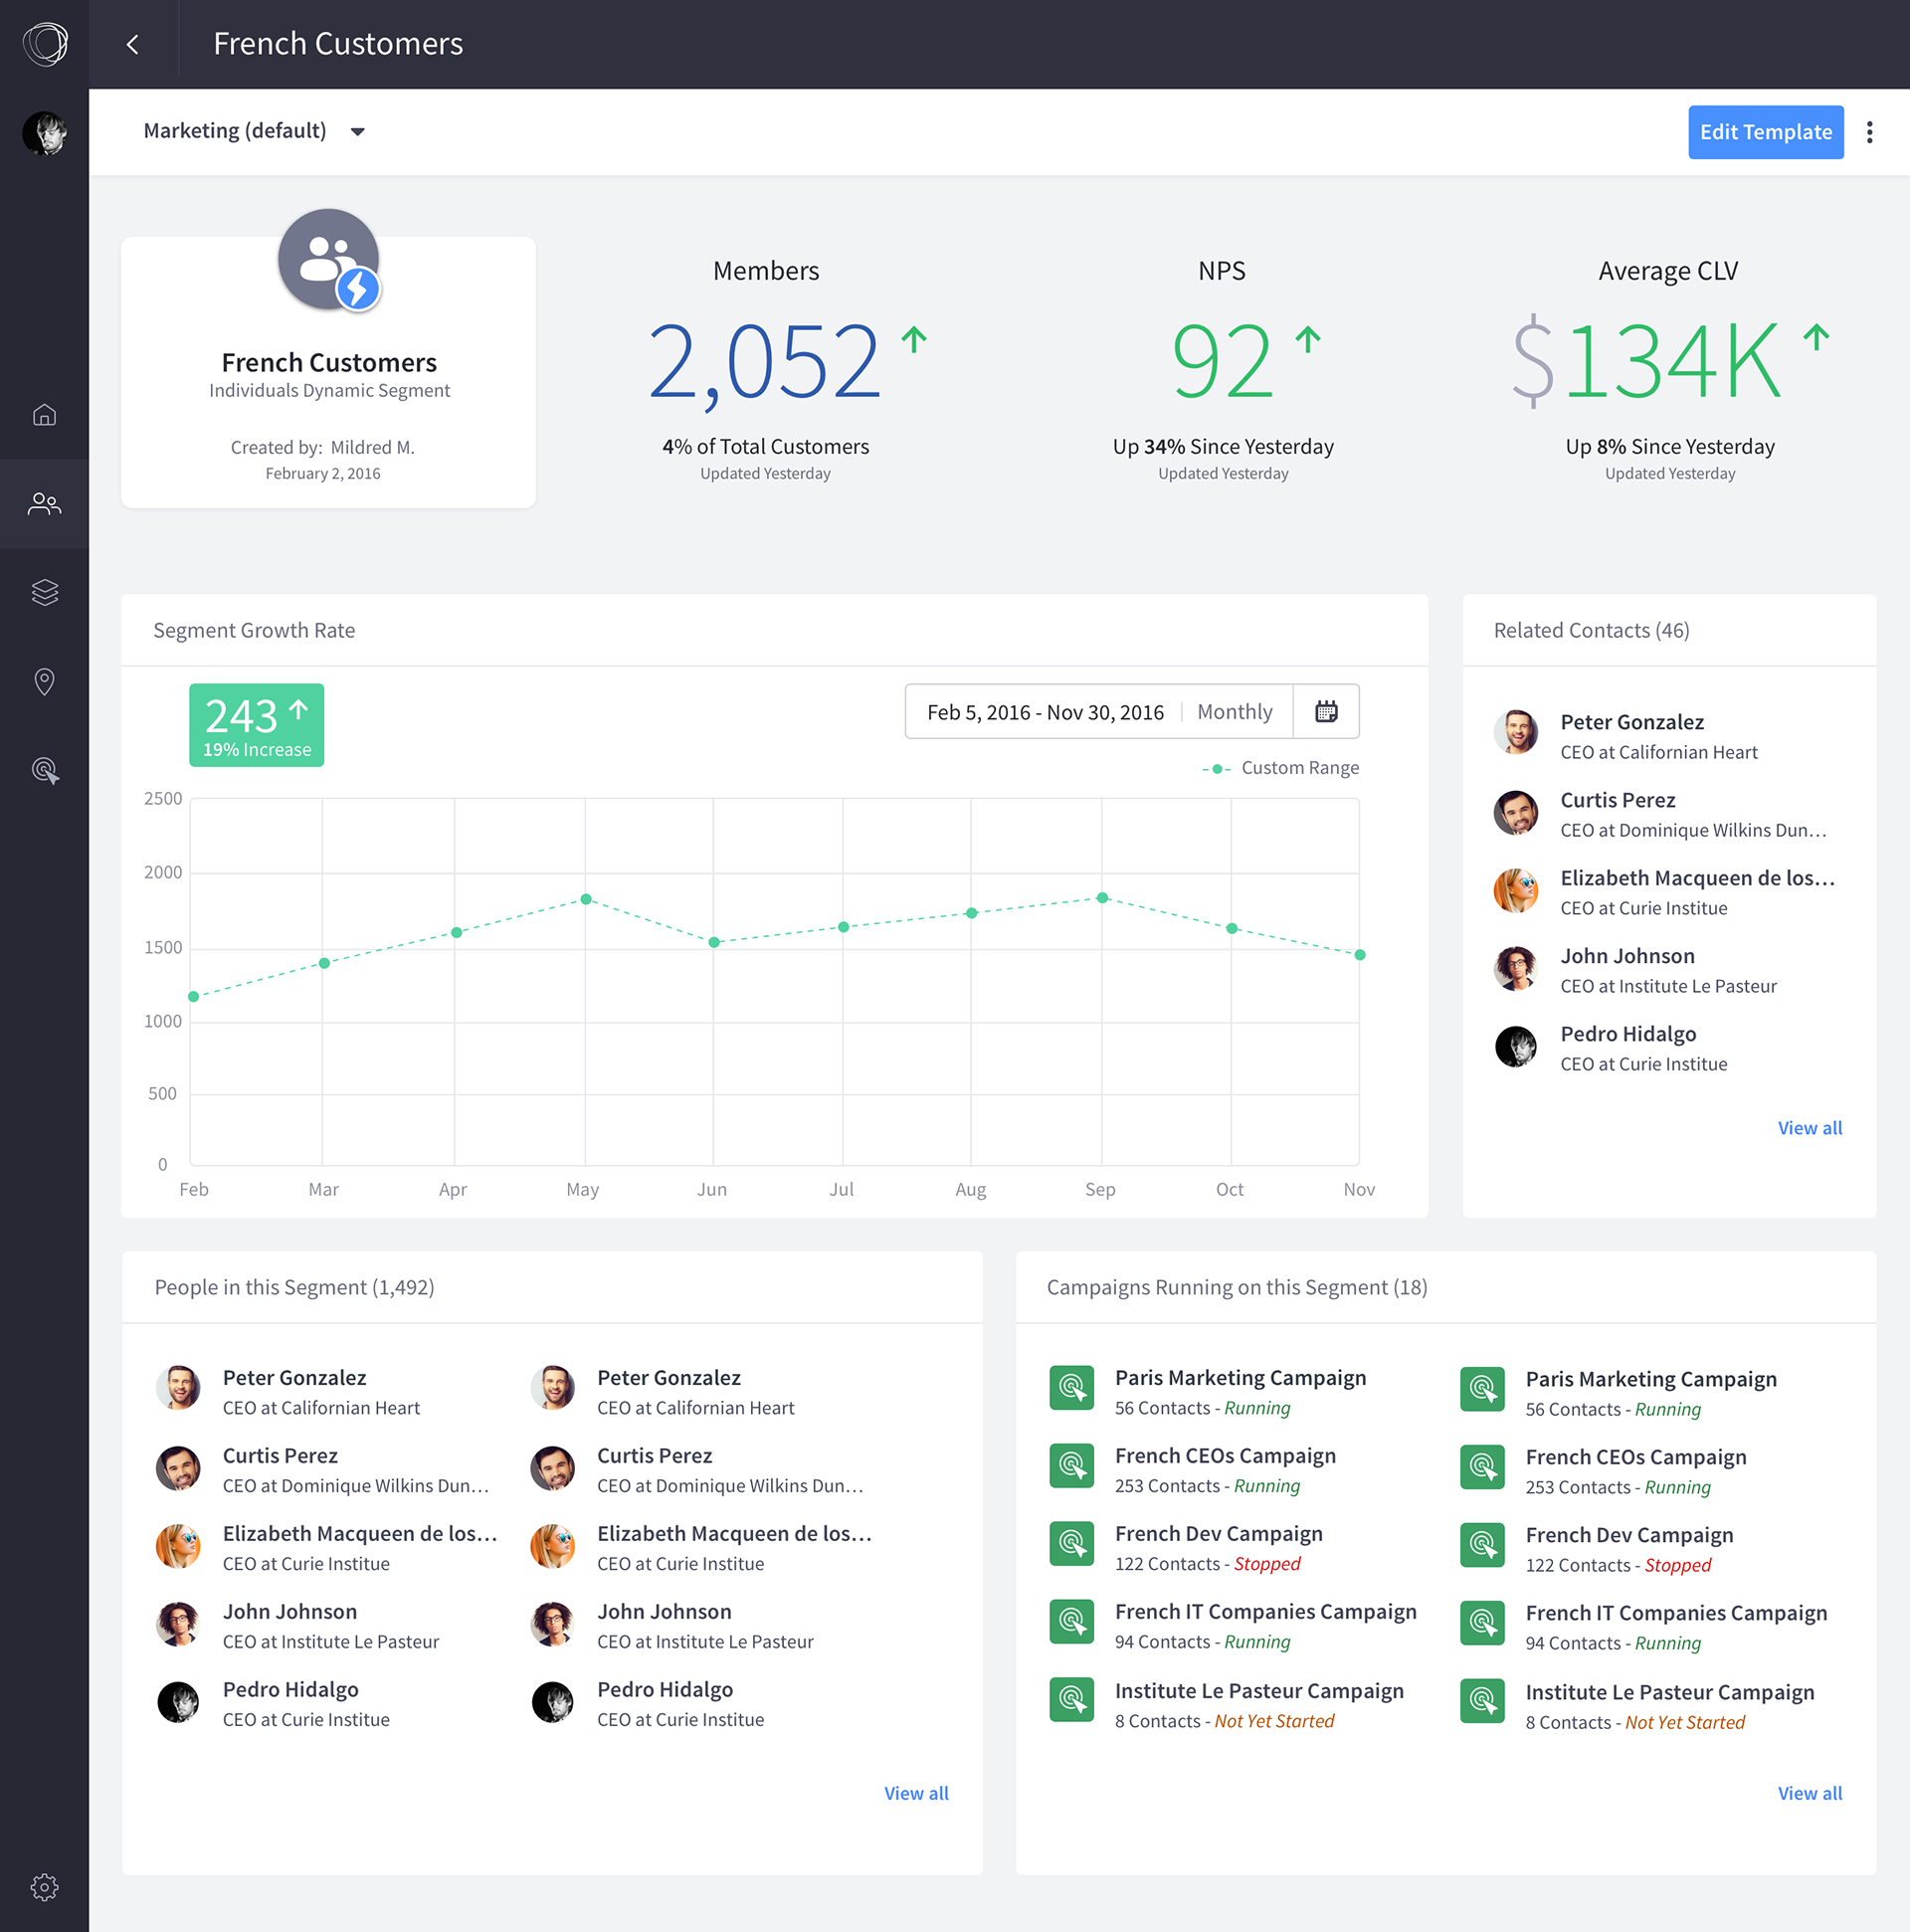
Example of an early dashboard. Dashboards would be iterated on a few times before release.
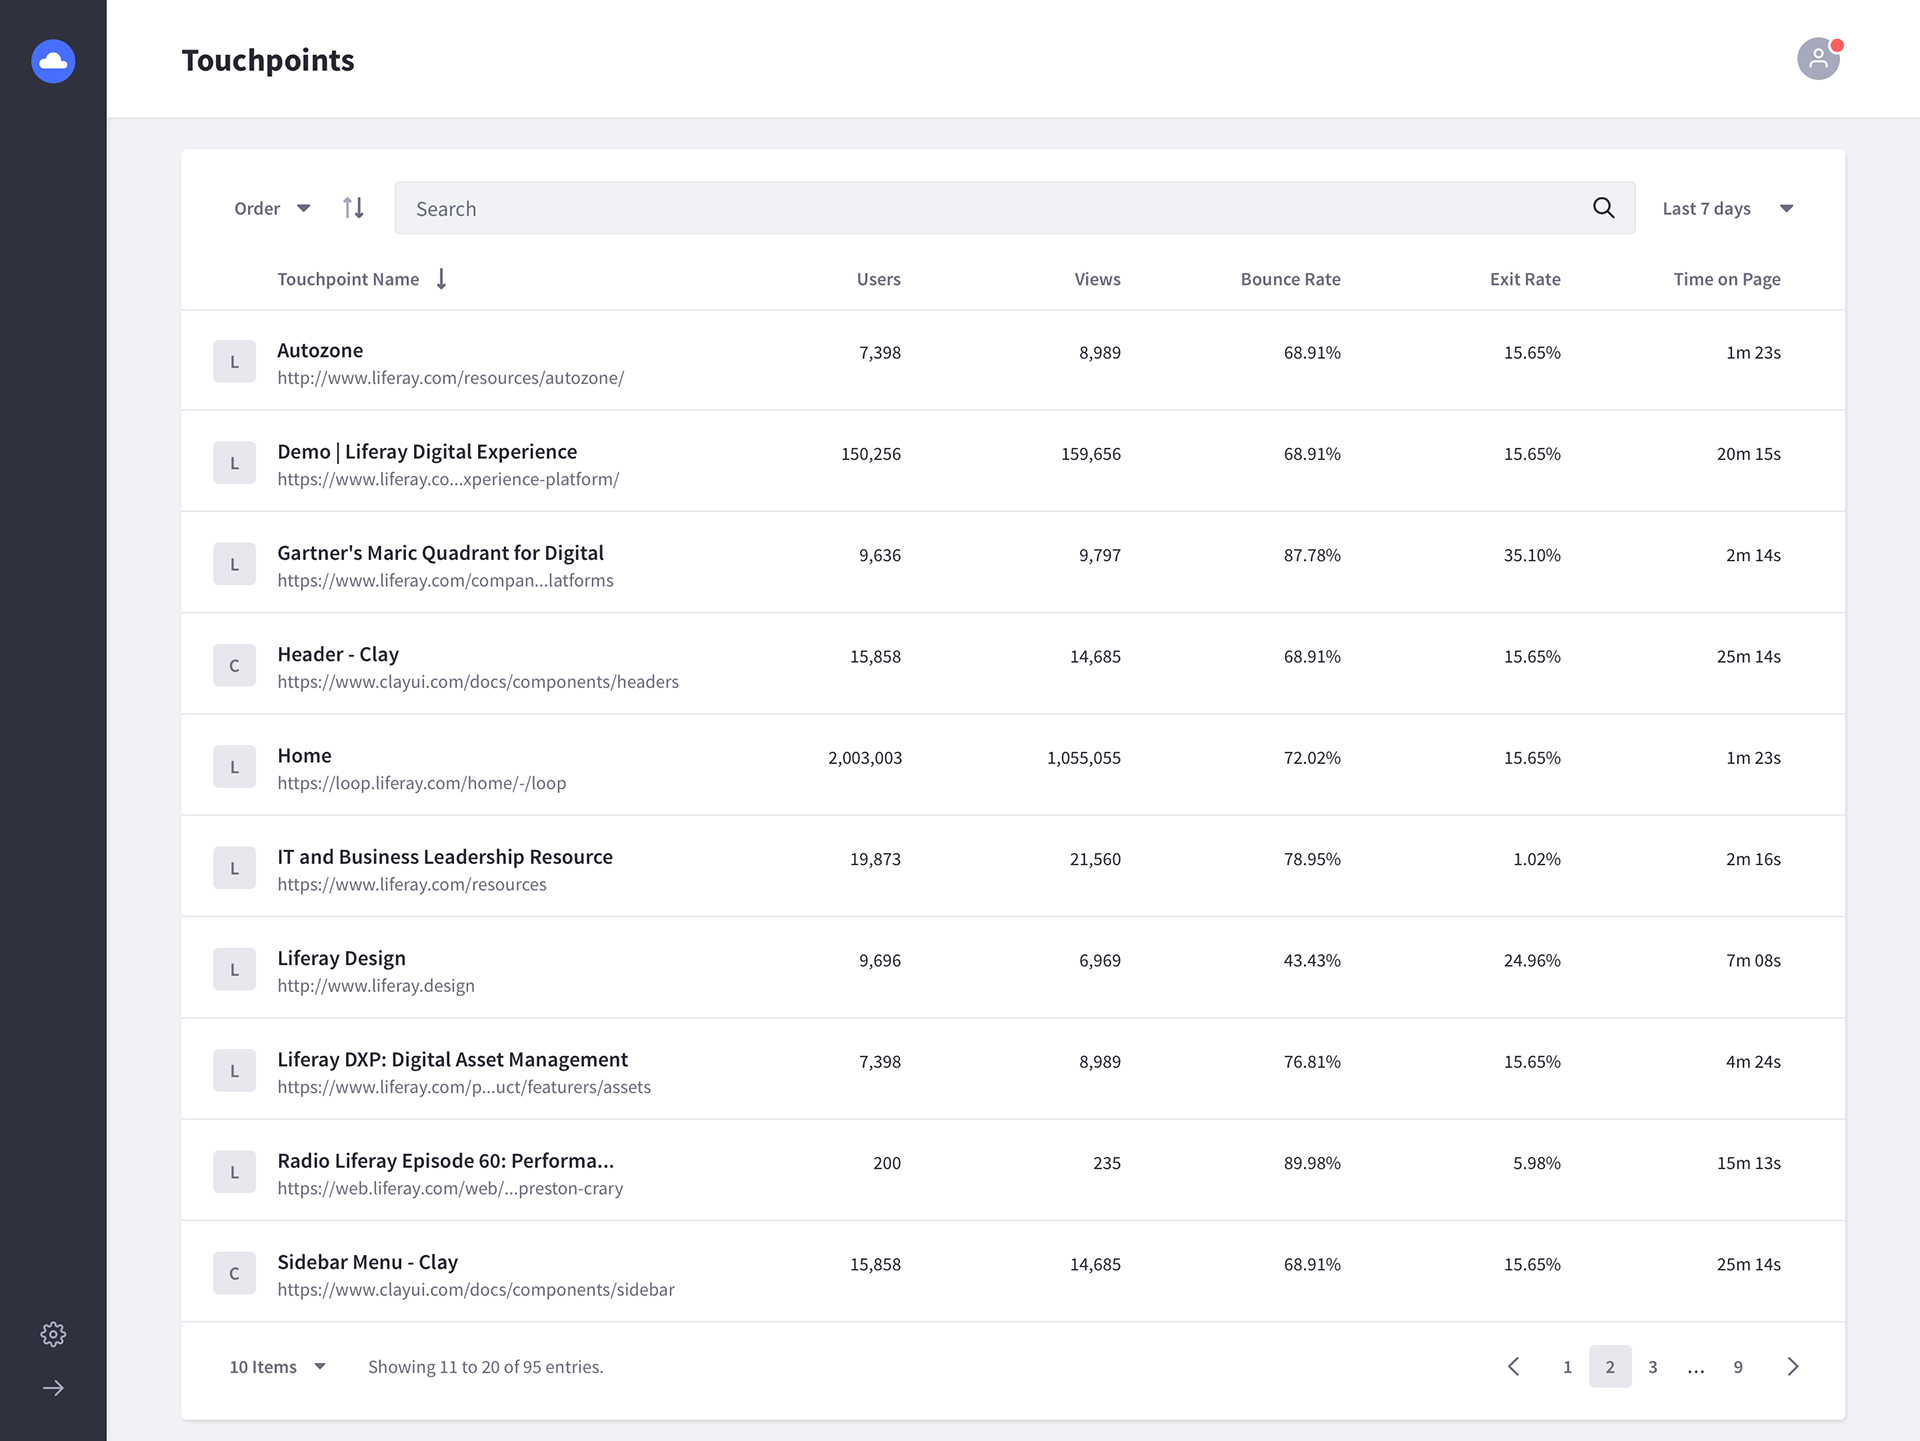
Example of a touchpoint list.